Essential Data Visualization Tools: Top 9 Picks for 2025
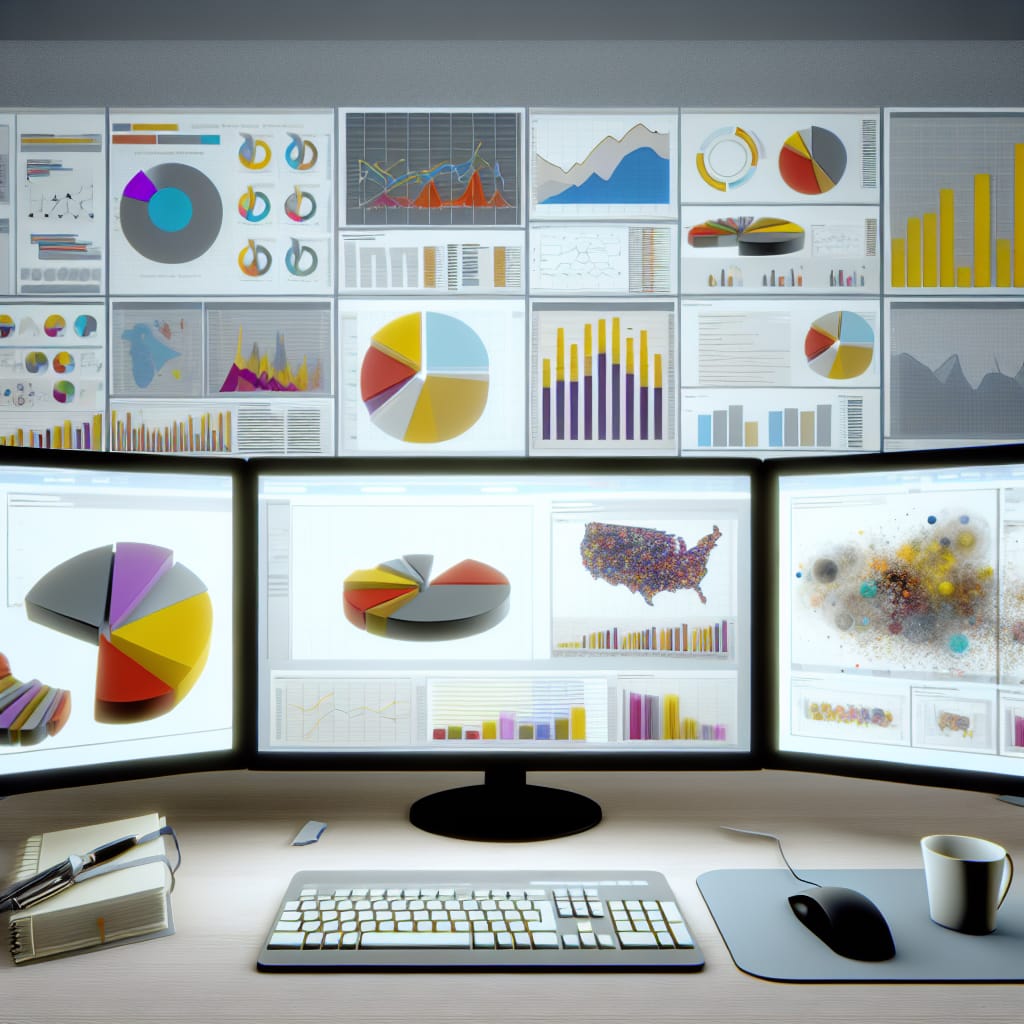
In the rapidly evolving field of data science, selecting the best data visualization tools is crucial for analysts aiming to transform abstract data sets into visual insights. With the explosion of data, both AI professionals and data enthusiasts are on a relentless quest for tools that not only display data effectively but also enhance decision-making processes. This article delves into the most advanced tools available in 2025 that cater specifically to the needs of analysts and data scientists. We’ll explore cutting-edge applications and frameworks, showcasing their capabilities and potential uses. Whether you’re an AI professional seeking to upgrade your toolset or a data science student exploring new territories, understanding these tools can provide a significant edge in your projects. Let’s dive into the most powerful options that are setting new standards.
Table of Contents
Power BI
Microsoft Power BI is renowned for its robust integration capabilities, making it a top choice among business analysts. Its seamless connectivity with Microsoft applications and easy data sharing features simplify collaborative efforts. Power BI offers AI-infused insights, allowing users to uncover trends with just a few clicks. A vital aspect of its strength lies in its custom visualizations, which enable the design of tailored reporting dashboards.
Tableau
Tableau stands out with its user-friendly interface and strong analytical capabilities. It supports the rapid creation of interactive and shareable dashboards that allow easy data exploration. Tableau’s advanced visualization features are complemented by its easy connectivity to various data sources, from cloud databases to simple Excel files. A real-world example is its use in the healthcare industry to track patient data and optimize service delivery.
D3.js
D3.js is a powerful JavaScript library for producing dynamic, interactive data visualizations in web browsers. It allows for detailed control over the final output and lets users manipulate documents based on data. Its versatility is highly revered in custom applications requiring complex visualizations. A robust example of D3.js in action would be a dynamic stock market visualization that adjusts in real-time.
Matplotlib
Matplotlib is a fundamental library for data visualization in Python, often used in conjunction with NumPy. It’s excellent for creating static, animated, and interactive visualizations. Particularly popular in the academic realm, it supports a wide variety of graphs and plots, making it essential for detailed scientific publications. Matplotlib drives significant insights generation at institutions like NASA for visualizing complex space exploration data.
Seaborn
An extension of Matplotlib, Seaborn is a statistical data visualization library that helps make complex plots simple. By providing a high-level interface for drawing attractive and informative graphics, Seaborn allows analysts to easily explore and understand their data sets. It is particularly adept at making heat maps and violin plots, which are useful in fields like bioinformatics and finance.
Google Data Studio
Google Data Studio is a free yet comprehensive tool for creating detailed reports and dashboards. With seamless integration with Google Analytics, BigQuery, and other Google services, it’s ideal for organizations relying on G Suite. Its collaborative framework ensures stakeholders can view and interact with data visualizations directly, enhancing transparency and decision-making processes within teams.
Looker
Looker, part of the Google Cloud Platform, is structured for modern DataOps workflows. It allows businesses to leverage real-time data to inform decisions with its powerful integration capabilities. Looker’s strength is its ability to utilize SQL and its complete cloud-native capability making it a preferred option for tech-savvy analysts.
Plotly
Plotly lets users create web-ready, interactive graphs and is highly sought after for sharing complex visualizations online. Commonly used within Jupyter notebooks, Plotly’s high-quality visualizations are crucial for data journalism and academic tutorials. Its Graphing Libraries are also used by large corporations like KPMG for client-ready presentations.
Qlik Sense
Qlik Sense is revered for its modern analytics platform, combining AI and machine learning capabilities. It supports interactive, self-service data exploration, and its powerful Qlik Associative Engine helps connect various data sets fluidly. Companies often utilize Qlik Sense for enterprise-wide integration, ensuring data-driven insights permeate throughout their operations.
Frequently Asked Questions
What are the benefits of using data visualization tools?
Data visualization tools help transform complex data sets into graphical representations, making it easier to identify patterns, trends, and outliers for informed decision-making.
Which tool is best for integrating with cloud services?
Looker and Google Data Studio are ideal for cloud integrations, leveraging robust connections with Google Cloud and other cloud services to streamline workflows.
Are there free data visualization tools available?
Yes, tools like Google Data Studio and Matplotlib are free, offering powerful features for creating a wide array of visualizations without any cost.
What factors should be considered when choosing a data visualization tool?
Consider aspects such as ease of use, integration capabilities, data source compatibility, types of visualizations supported, and the tool’s scalability and customization options.
Conclusion
In 2025, the landscape of data visualization tools is vibrant and diverse, offering solutions to meet the unique needs of every analyst. Tools like Power BI and Tableau excel in dashboard visualization, while D3.js and Matplotlib cater to custom and detailed visual outputs. It’s crucial for data professionals to stay abreast of emerging trends and capabilities in these tools to remain competitive. Exploring these tools further and experimenting with their capabilities can undoubtedly refine your visualization prowess. For more on enhancing your data skills, consider subscribing to our blog or exploring our in-depth guides.


